Network Troubleshooting: Consider The Load Balancer

Which Mode?

Troubleshooting network issues can be tricky, and adding a load balancer into the mix creates additional challenges. Trying to discern if the load balancer is simply dropping packets, changing the packets in some way, or adding more latency can be difficult. There are some tricks of the trade that can be employed to make finding the issues easier.

The first step of any troubleshooting exercise is to check the statistics of the entity in question. However, if those statistics state that everything is fine, and the network issue is still occurring, then you have to bring in the "Switzerland" of the troubleshooting world -- packet analysis. While there are many excellent paid products out there for packet analysis, I prefer the open source Wireshark.

When analyzing an issue that involves a load balancer, the first question to be answered is whether the load balancer is in transparent mode. In transparent mode, the load balancer will pass the original client's IP as the source IP. In non-transparent mode, the load balancer will NAT the requests to the servers with the load balancer's virtual IP address, or VIP. Non-transparent mode is the most common implementation.

Multiple Vantage Points

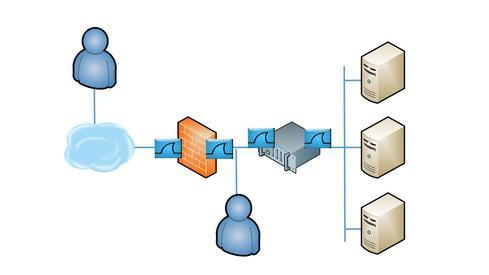
Now you are ready to take the trace files aka pcaps. In a perfect world, you would have taps to insert at each of the points in the diagram below. If you don't have taps, you can capture traffic using a SPAN or mirror port on the switch. Or you can use tcpdump on the inbound and outbound ports of the firewall and load balancer. The key is to capture packets in all four places at one time to look at conversations from four different vantage points.


After you capture the data, you must find single conversations that appear in all four of the trace files. Normally, you would filter for the two IP addresses in question and be done. But, remember the load balancer performs NAT on the server side, so filtering for the client IP won't work on the server-side trace.

Going up to Layer 4 solves the problem. You can filter on the sequence number in the TCP header. Be careful, though; Wireshark shows relative sequence numbers by default, and you may end up with hundreds of packets with sequence number 1. The key is to turn off relative sequence numbers in the TCP preferences. Just uncheck the selection and the actual billions decimal number displays instead of the one relative to the beginning of the conversation. Once you filter for the same sequence number in all four trace files, you should have one packet in each file.

Filter for Unique Fields in Each PCAP

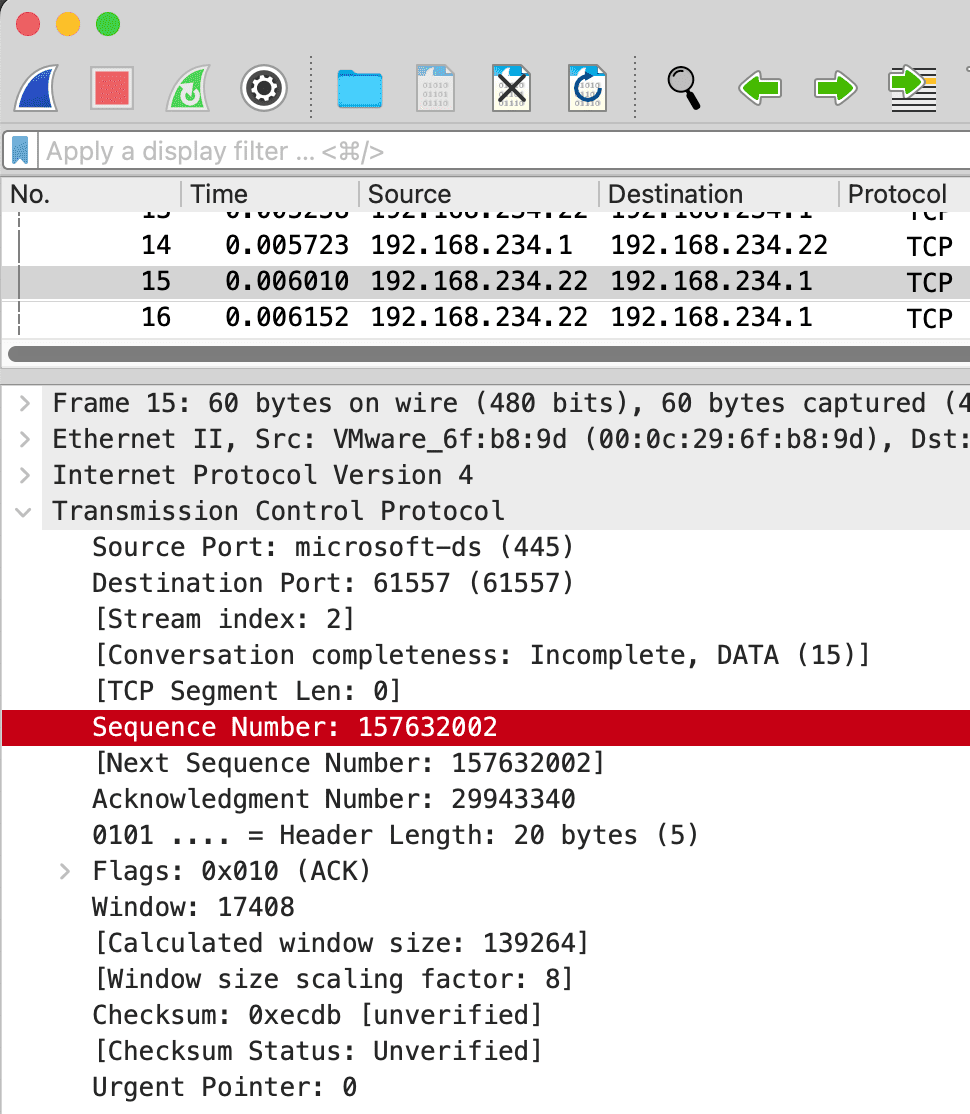
The tricky part comes in if your load balancer creates its own packets on the NAT side to the server. The TCP sequence field would then no longer be the same from end to end. The best field to use in that scenario is one that is unique in the application layer. For HTTP, I recommend the Cookie field, and for HTTPS, the Random Bytes field in the Client Hello.


Written by Betty DuBois

Please Share